


Statistics for Ecologists Using R and Excel 2nd edition
Data Collection, Exploration, Analysis and Presentation
- Step-by-step instruction on all common statistical tests in R and Excel
- Heavily illustrated with screenshots and code examples
- Extensive support material and end-of-chapter exercises
- ... a superb way in for all those looking at how to design investigations and collect data to support their findings.
—Sue Townsend, Biodiversity Learning Manager, Field Studies Council
- biology
- data
- data analysis
- data collection
- ecology
- Excel
- R
- statistics
Related Books
Description
This is a book about the scientific process and how you apply it to data in ecology. You will learn how to plan for data collection, how to assemble data, how to analyze data and finally how to present the results. The book uses Microsoft Excel and the powerful Open Source R program to carry out data handling as well as producing graphs.
Statistical approaches covered include: data exploration; tests for difference – t-test and U-test; correlation – Spearman’s rank test and Pearson product-moment; association including Chi-squared tests and goodness of fit; multivariate testing using analysis of variance (ANOVA) and Kruskal–Wallis test; and multiple regression.
Key skills taught in this book include: how to plan ecological projects; how to record and assemble your data; how to use R and Excel for data analysis and graphs; how to carry out a wide range of statistical analyses including analysis of variance and regression; how to create professional looking graphs; and how to present your results.
New in this edition: a completely revised chapter on graphics including graph types and their uses, Excel Chart Tools, R graphics commands and producing different chart types in Excel and in R; an expanded range of support material online, including; example data, exercises and additional notes & explanations; a new chapter on basic community statistics, biodiversity and similarity; chapter summaries and end-of-chapter exercises.
Praise for the first edition:
A must for anyone getting to grips with data analysis using R and excel. – Amazon 5-star review
It has been very easy to follow and will be perfect for anyone. – Amazon 5-star review
A solid introduction to working with Excel and R. The writing is clear and informative, the book provides plenty of examples and figures so that each string of code in R or step in Excel is understood by the reader. – Goodreads, 4-star review
Readership
Students of biology, ecology and environmental scienceTable of Contents
Preface xi
1. Planning
2. Data recording
3. Beginning data exploration – using software tools
4. Exploring data – looking at numbers
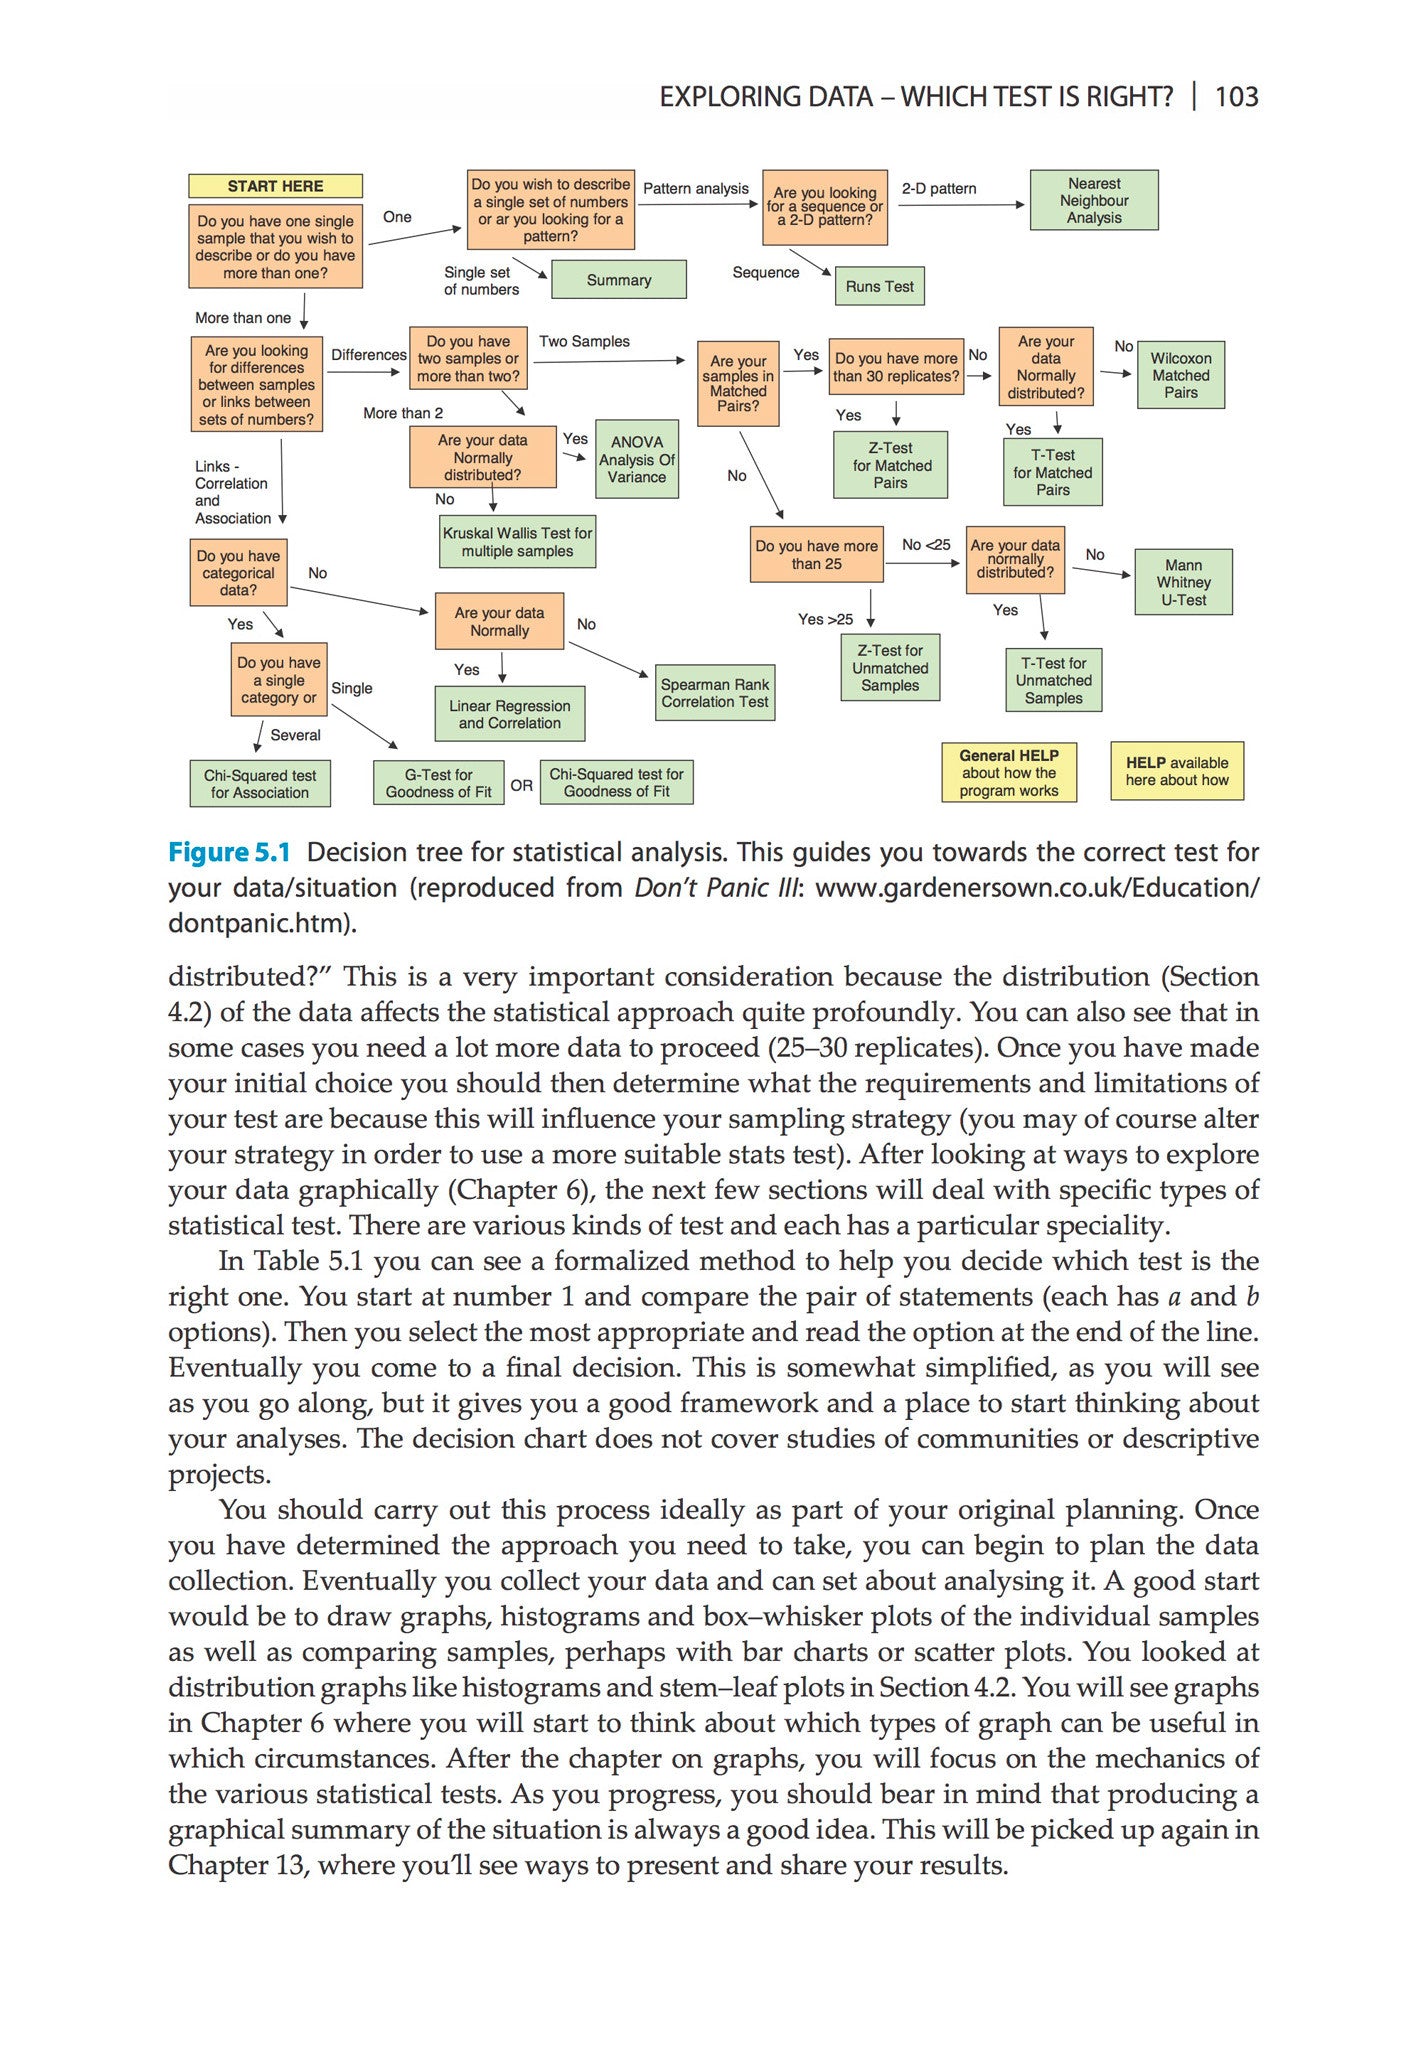
5. Exploring data – which test is right?
6. Exploring data – using graphs
7. Tests for differences
8. Tests for linking data – correlations
9. Tests for linking data – associations
10. Differences between more than two samples
11. Tests for linking several factors
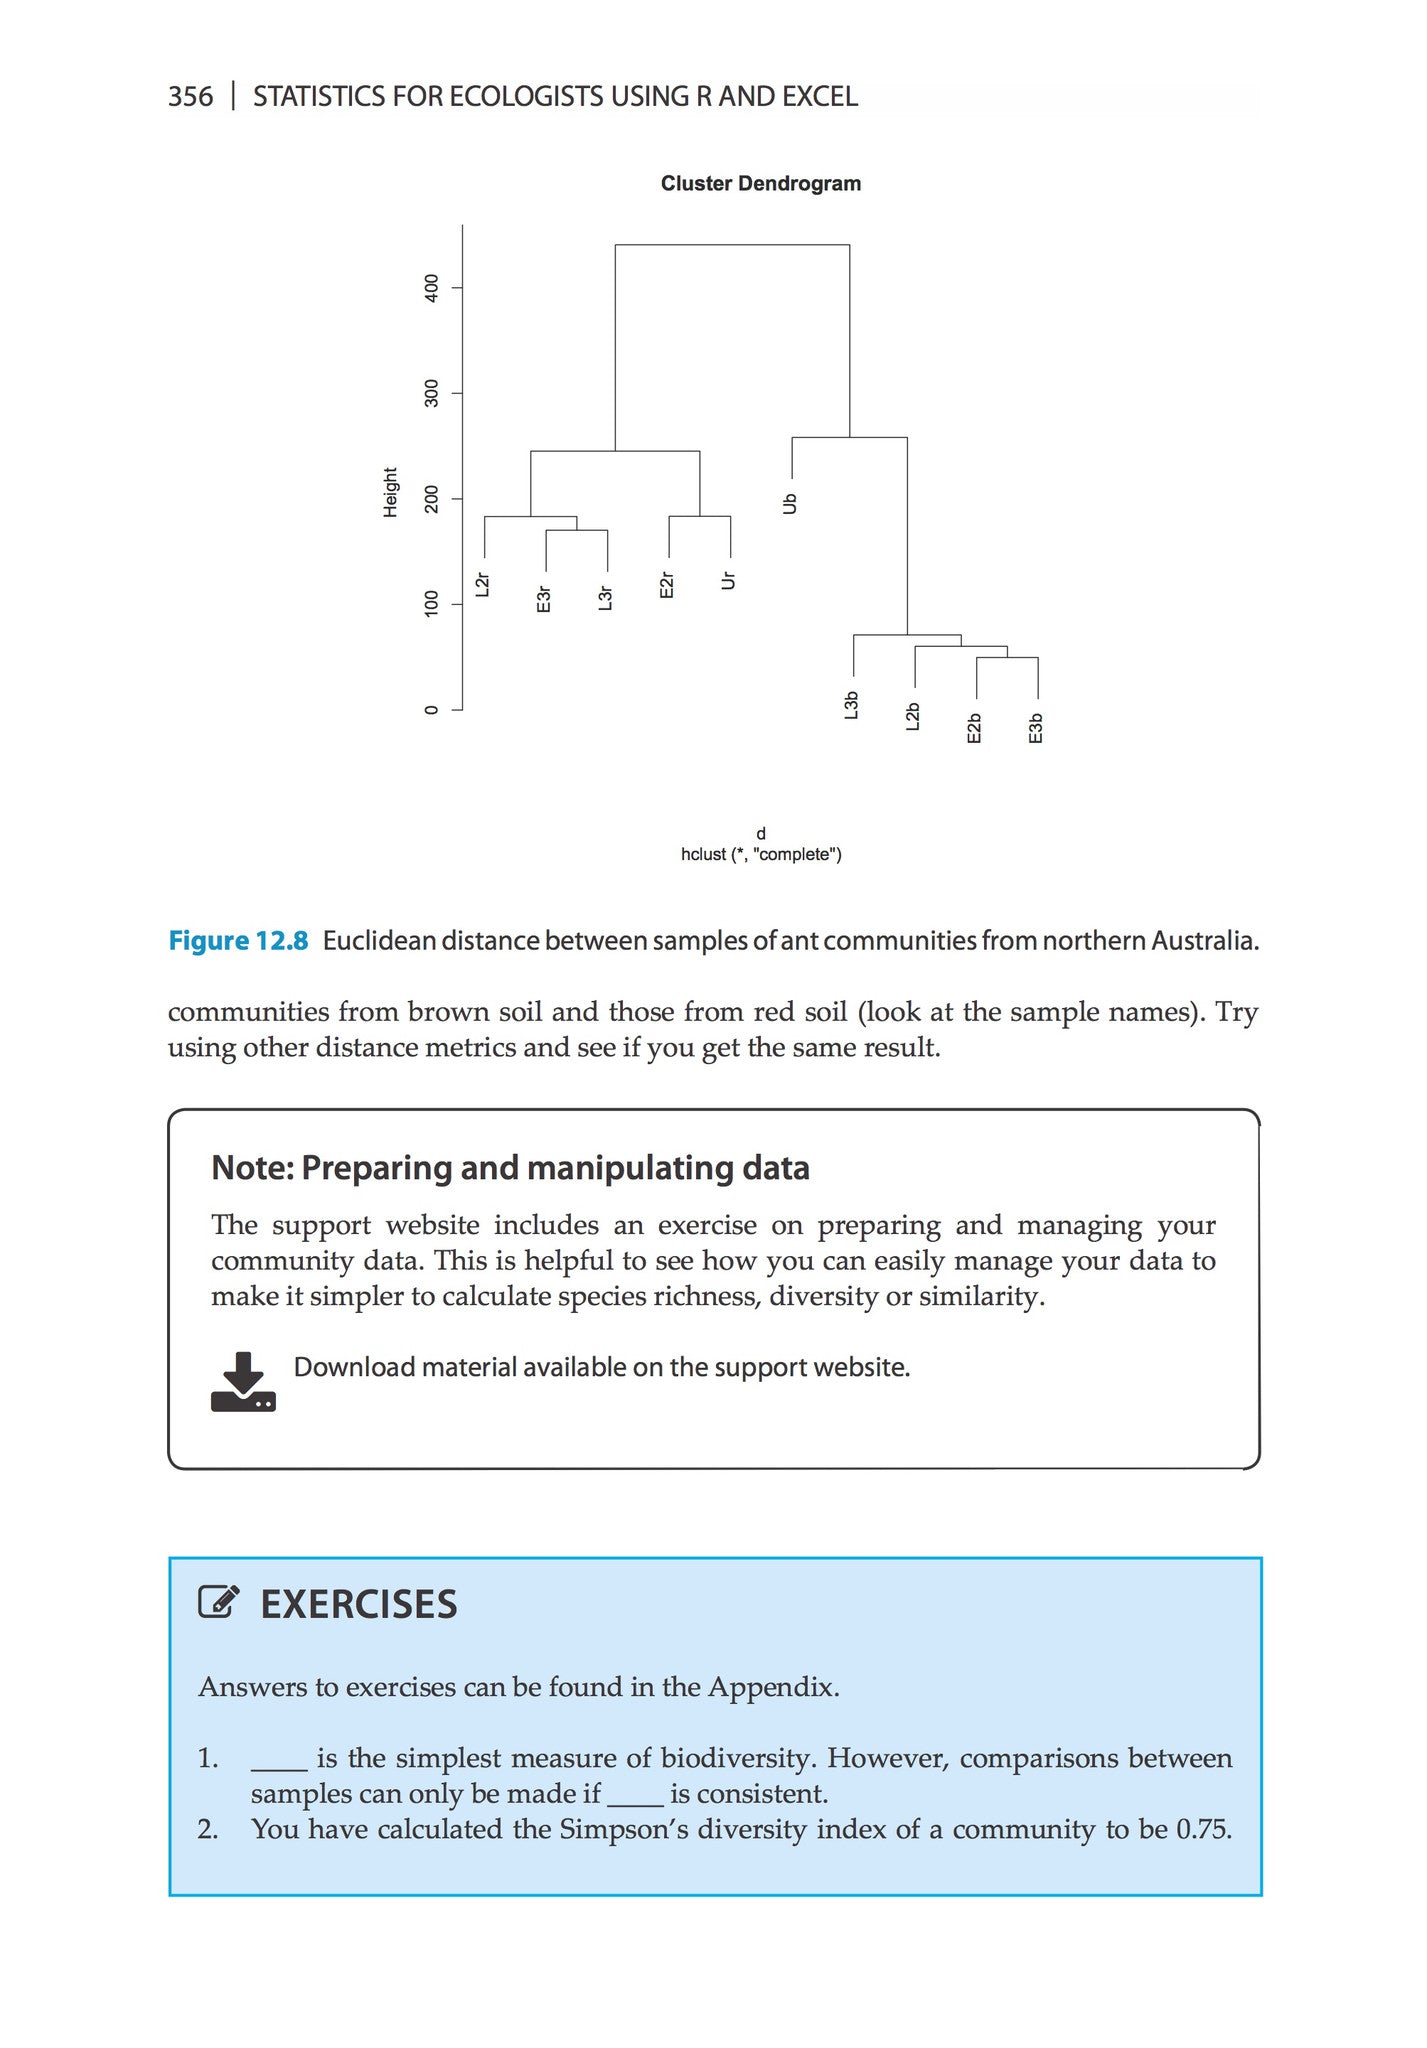
12. Community ecology
13. Reporting results
14. Summary
Glossary
Appendices
Index
Reviews
- This book is a superb way in for all those looking at how to design investigations and collect data to support their findings. (This review refers to the first edition.) —Sue Townsend, Biodiversity Learning Manager, Field Studies Council
- The text that I have found most helpful in getting back to using R has been Mark Gardener's Statistics for Ecologists Using R and Excel. This excellent little book leads the reader nicely through the basics. Starting with how to down load R and getting data into the programme through exploratory statistics and into basic analysis with a section on reporting results which includes visualising data. It also makes it easy for the reader to synthesise R and Excel and there is extra help and sample data available on the free companion webpage if needed. I recommended this text to the university library as well as to colleagues at my student workshops on R. (This review refers to the first edition.) —Mark Edwards, EcoBlogging
- I truly love the book and think it fills an important niche. — Bradley E. Carlson, Wabash College
About the Author
Mark Gardener is an ecologist, lecturer and writer and has worked as a teacher and supervisor around the world. He runs courses in ecology, data analysis and R: the statistical programming language, for a variety of organizations.
Bibliographic Information
 406 pages
 - 196 figures
- 107 tables
- | 2nd Edition
- BISAC SCI020000, MAT029000
- BIC PSAF, PBT, UFCE