


Managing Data Using Excel
- Plenty of general Excel handbooks document how to create datasets and apply calculations, but the specific focus on scientific data manipulation provided here makes it a top recommendation over any general tutorial.
—Diane Donovan, Midwest Book Review
- data analysis
- data management
- dataset
- excel
- modelling
- professional development
Related Books


Description
Microsoft Excel is a powerful tool that can transform the way you use data. This book explains in comprehensive and user-friendly detail how to manage, make sense of, explore and share data, giving scientists at all levels the skills they need to maximize the usefulness of their data.
Readers will learn how to use Excel to:
* Build a dataset – how to handle variables and notes, rearrangements and edits to data.
* Check datasets – dealing with typographic errors, data validation and numerical
errors.
* Make sense of data – including datasets for regression and correlation; summarizing data with averages and variability; and visualizing data with graphs, pivot charts and sparklines.
* Explore regression data – finding, highlighting and visualizing correlations.
* Explore time-related data – using pivot tables, sparklines and line plots.
* Explore association data – creating and visualizing contingency tables.
* Explore differences – pivot tables and data visualizations including box-whisker plots.
* Share data – methods for exporting and sharing your datasets, summaries and
graphs.
Alongside the text, Have a Go exercises, Tips and Notes give readers practical experience and highlight important points, and helpful self-assessment exercises and summary tables can be found at the end of each chapter. Supplementary material can also be downloaded on the companion website.
Managing Data Using Excel is an essential book for all scientists and students who use data and are seeking to manage data more effectively. It is aimed at scientists at all levels but it is especially useful for university-level research, from undergraduates to postdoctoral researchers.
Readership
Scientists, researchers, undergraduates, postgraduatesTable of Contents
1. Arranging your data
2. Managing your data: building your dataset
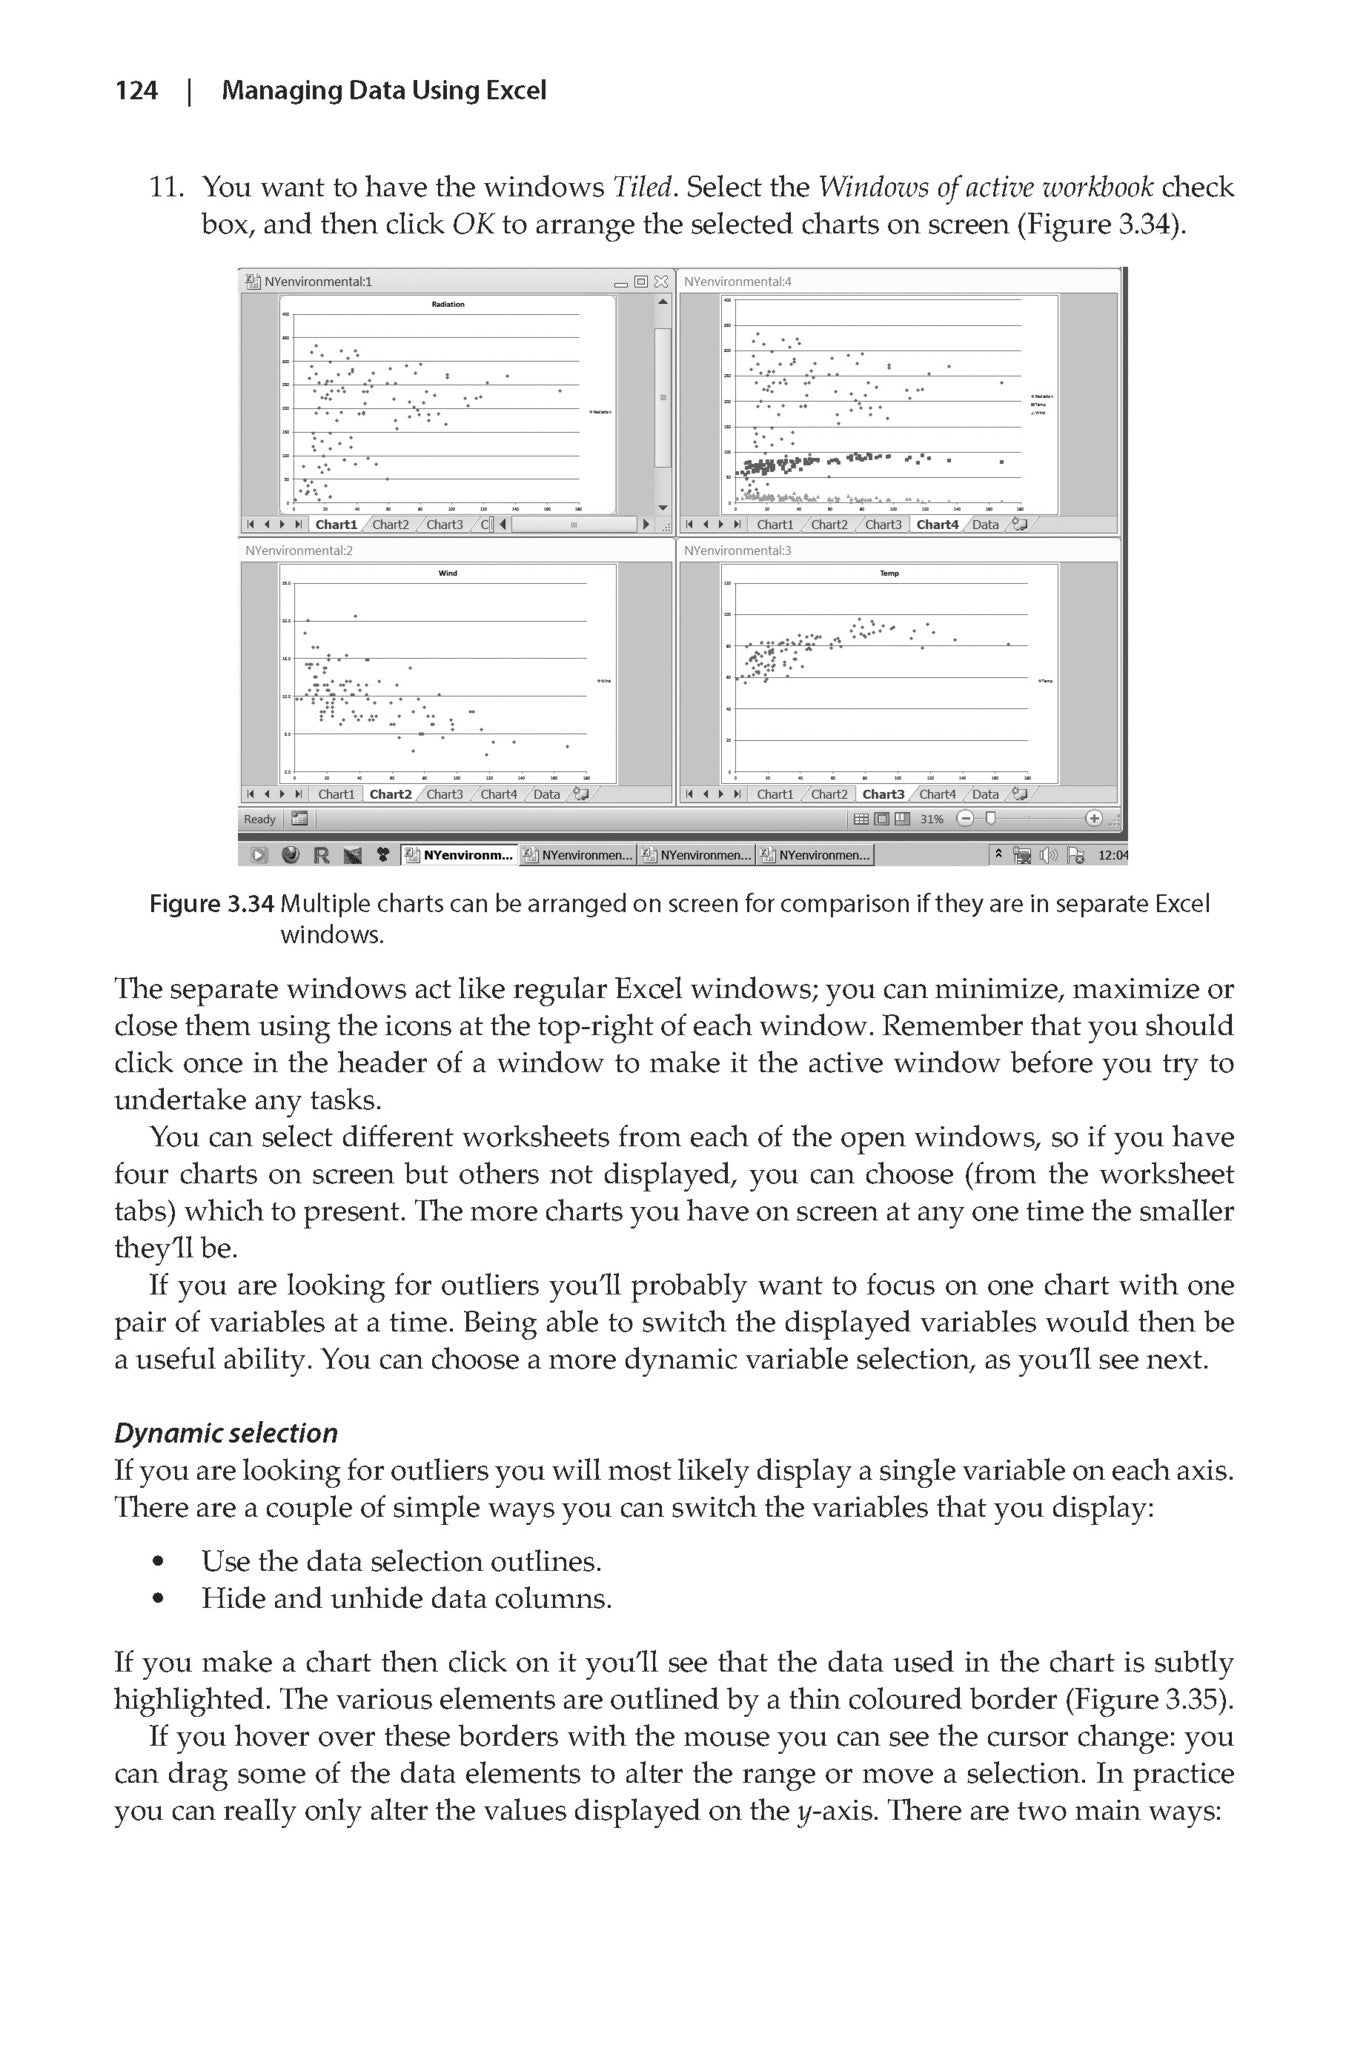
3. Managing your data: checking your dataset
4. Making sense of your data
5. Exploring regression data
6. Exploring time-related data
7. Exploring association data
8. Exploring differences data
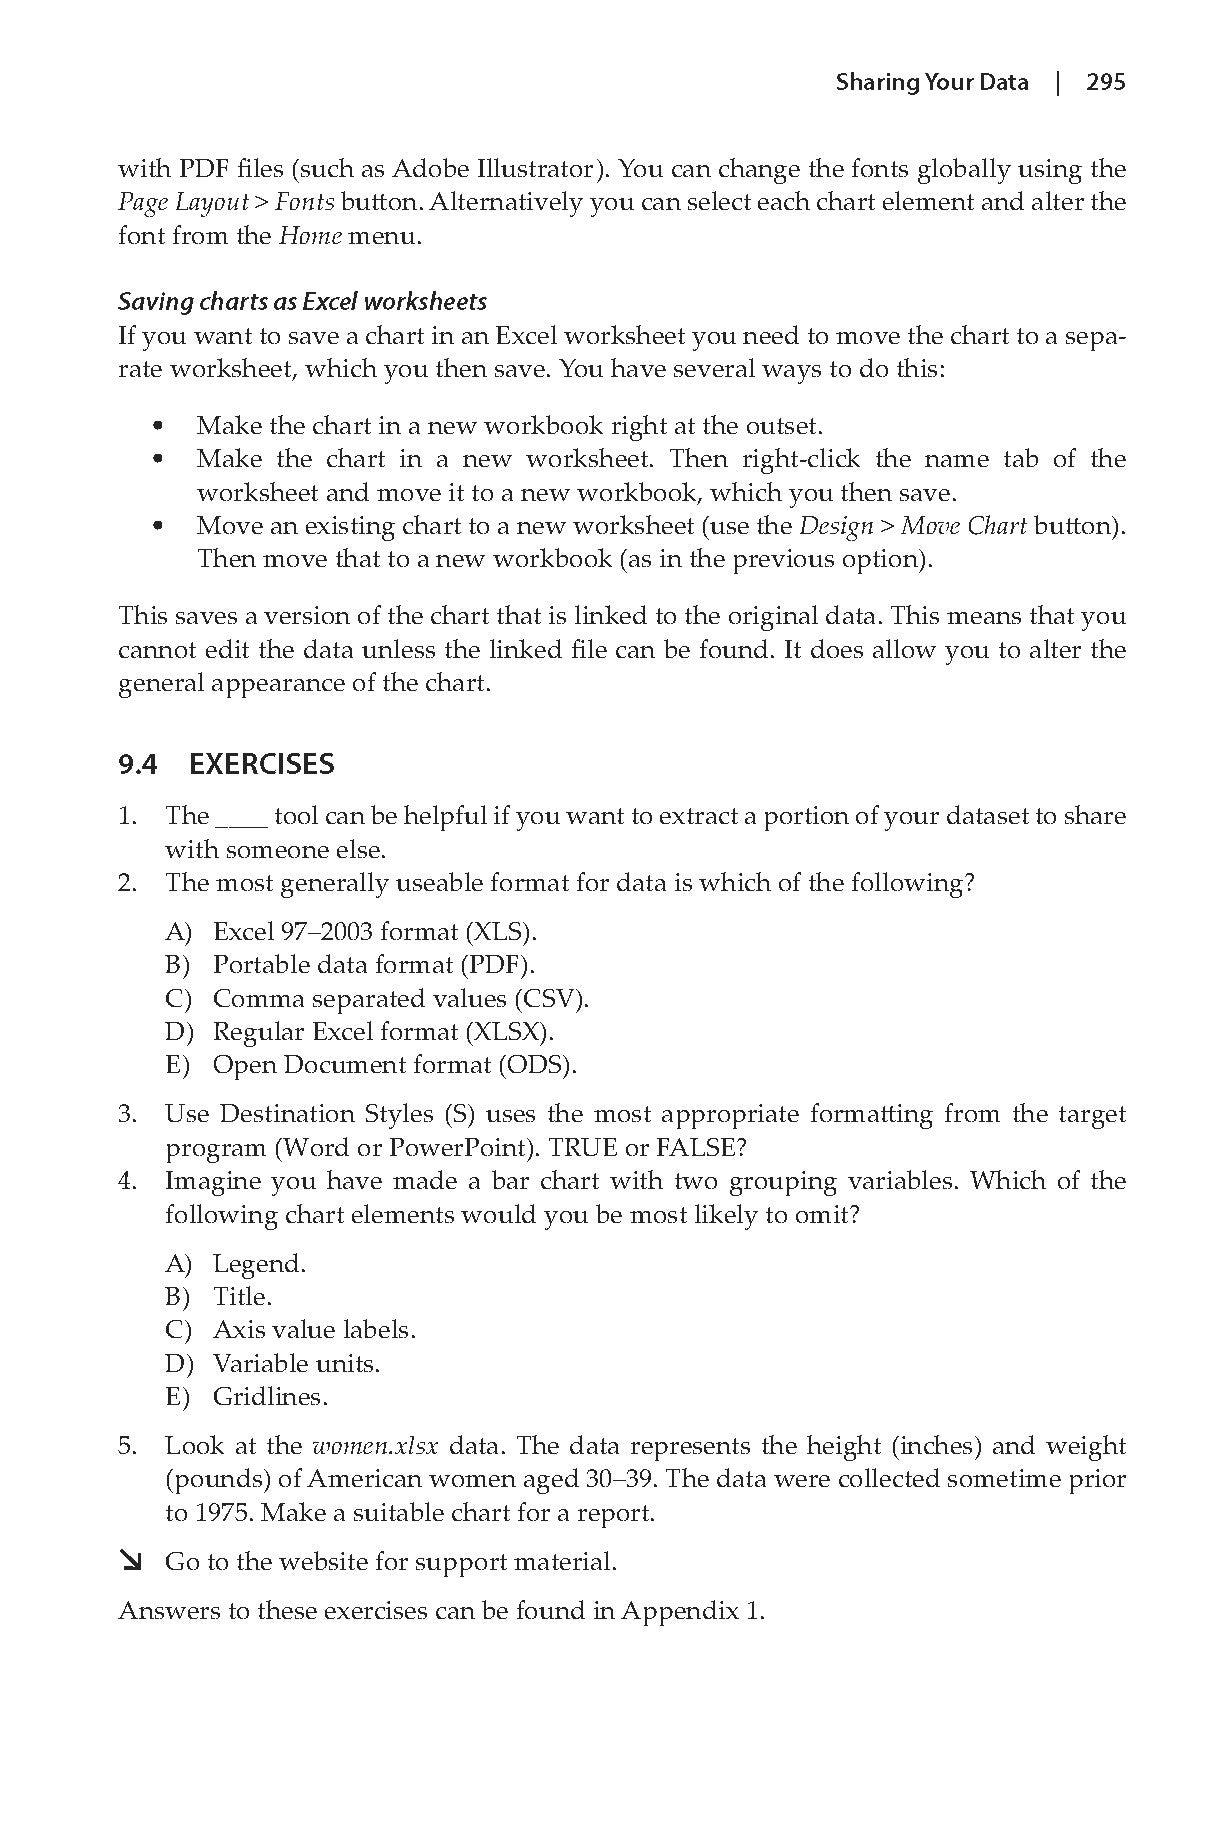
9. Sharing your data
Appendices
Index
Reviews
- Clearly the book is aimed at scientists, particularly those dealing with the analysis of observational data, but is it of value to a wider audience? Having worked through the book I would say that it is definitely worthwhile for many other groups, including those in engineering and other branches of science and technology, and also those in commercial and marketing work dealing with the analysis of numerical data of any kind. —Doug Jenkins, Newton Excel Bach blog
- Plenty of general Excel handbooks document how to create datasets and apply calculations, but the specific focus on scientific data manipulation provided here makes it a top recommendation over any general tutorial. —Diane Donovan, Midwest Book Review
About the Author
Mark Gardener (www.gardenersown.co.uk) is an ecologist, lecturer, and writer working in the UK. His primary area of research was in pollination ecology and he has worked in the UK and around the word (principally Australia and the United States). Since his doctorate he has worked in many areas of ecology, often as a teacher and supervisor. He believes that ecological data, especially community data, is the most complicated and ill-behaved and is consequently the most fun to work with. He was introduced to R by a like-minded pedant whilst working in Australia during his doctorate. Learning R was not only fun but opened up a new avenue, making the study of community ecology a whole lot easier. He is currently self-employed and runs courses in ecology, data analysis, and R for a variety of organizations. Mark lives in rural Devon with his wife Christine, a biochemist who consequently has little need of statistics.
Bibliographic Information
 326 pages
 - 202 figures
- 30 tables
- BISAC COM021000, COM021040, COM018000, COM062000, COM030000, COM021030, COM081000, EDU028000, SCI043000, COM051430
- BIC UFCE, GPH, UND, UNC, U, UB, UN, UNS, UFP, UFC